Quantcast
Channel: Craig Miller – KQED Science
Viewing all 77 articles
Browse latest View live

Possible Spoiler for El Niño: A ‘Battle of the Blobs’

$
0
0

Listen to the story:


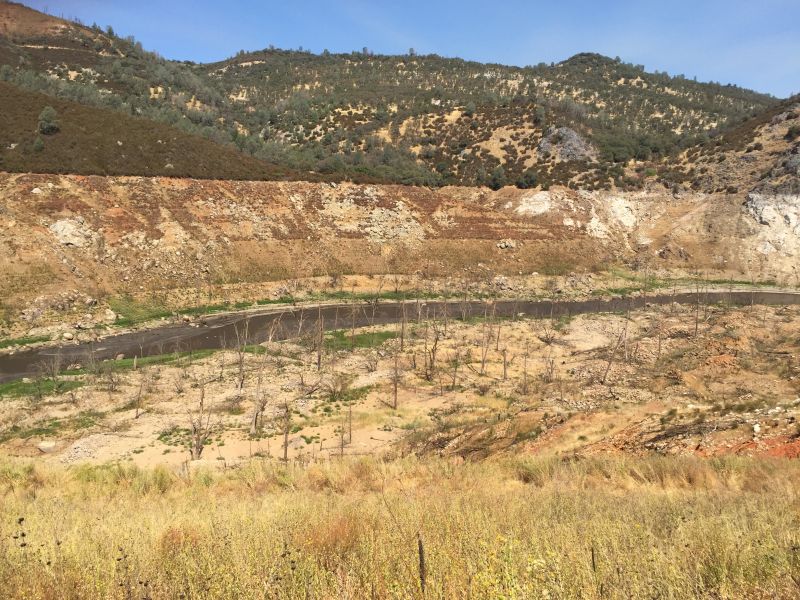
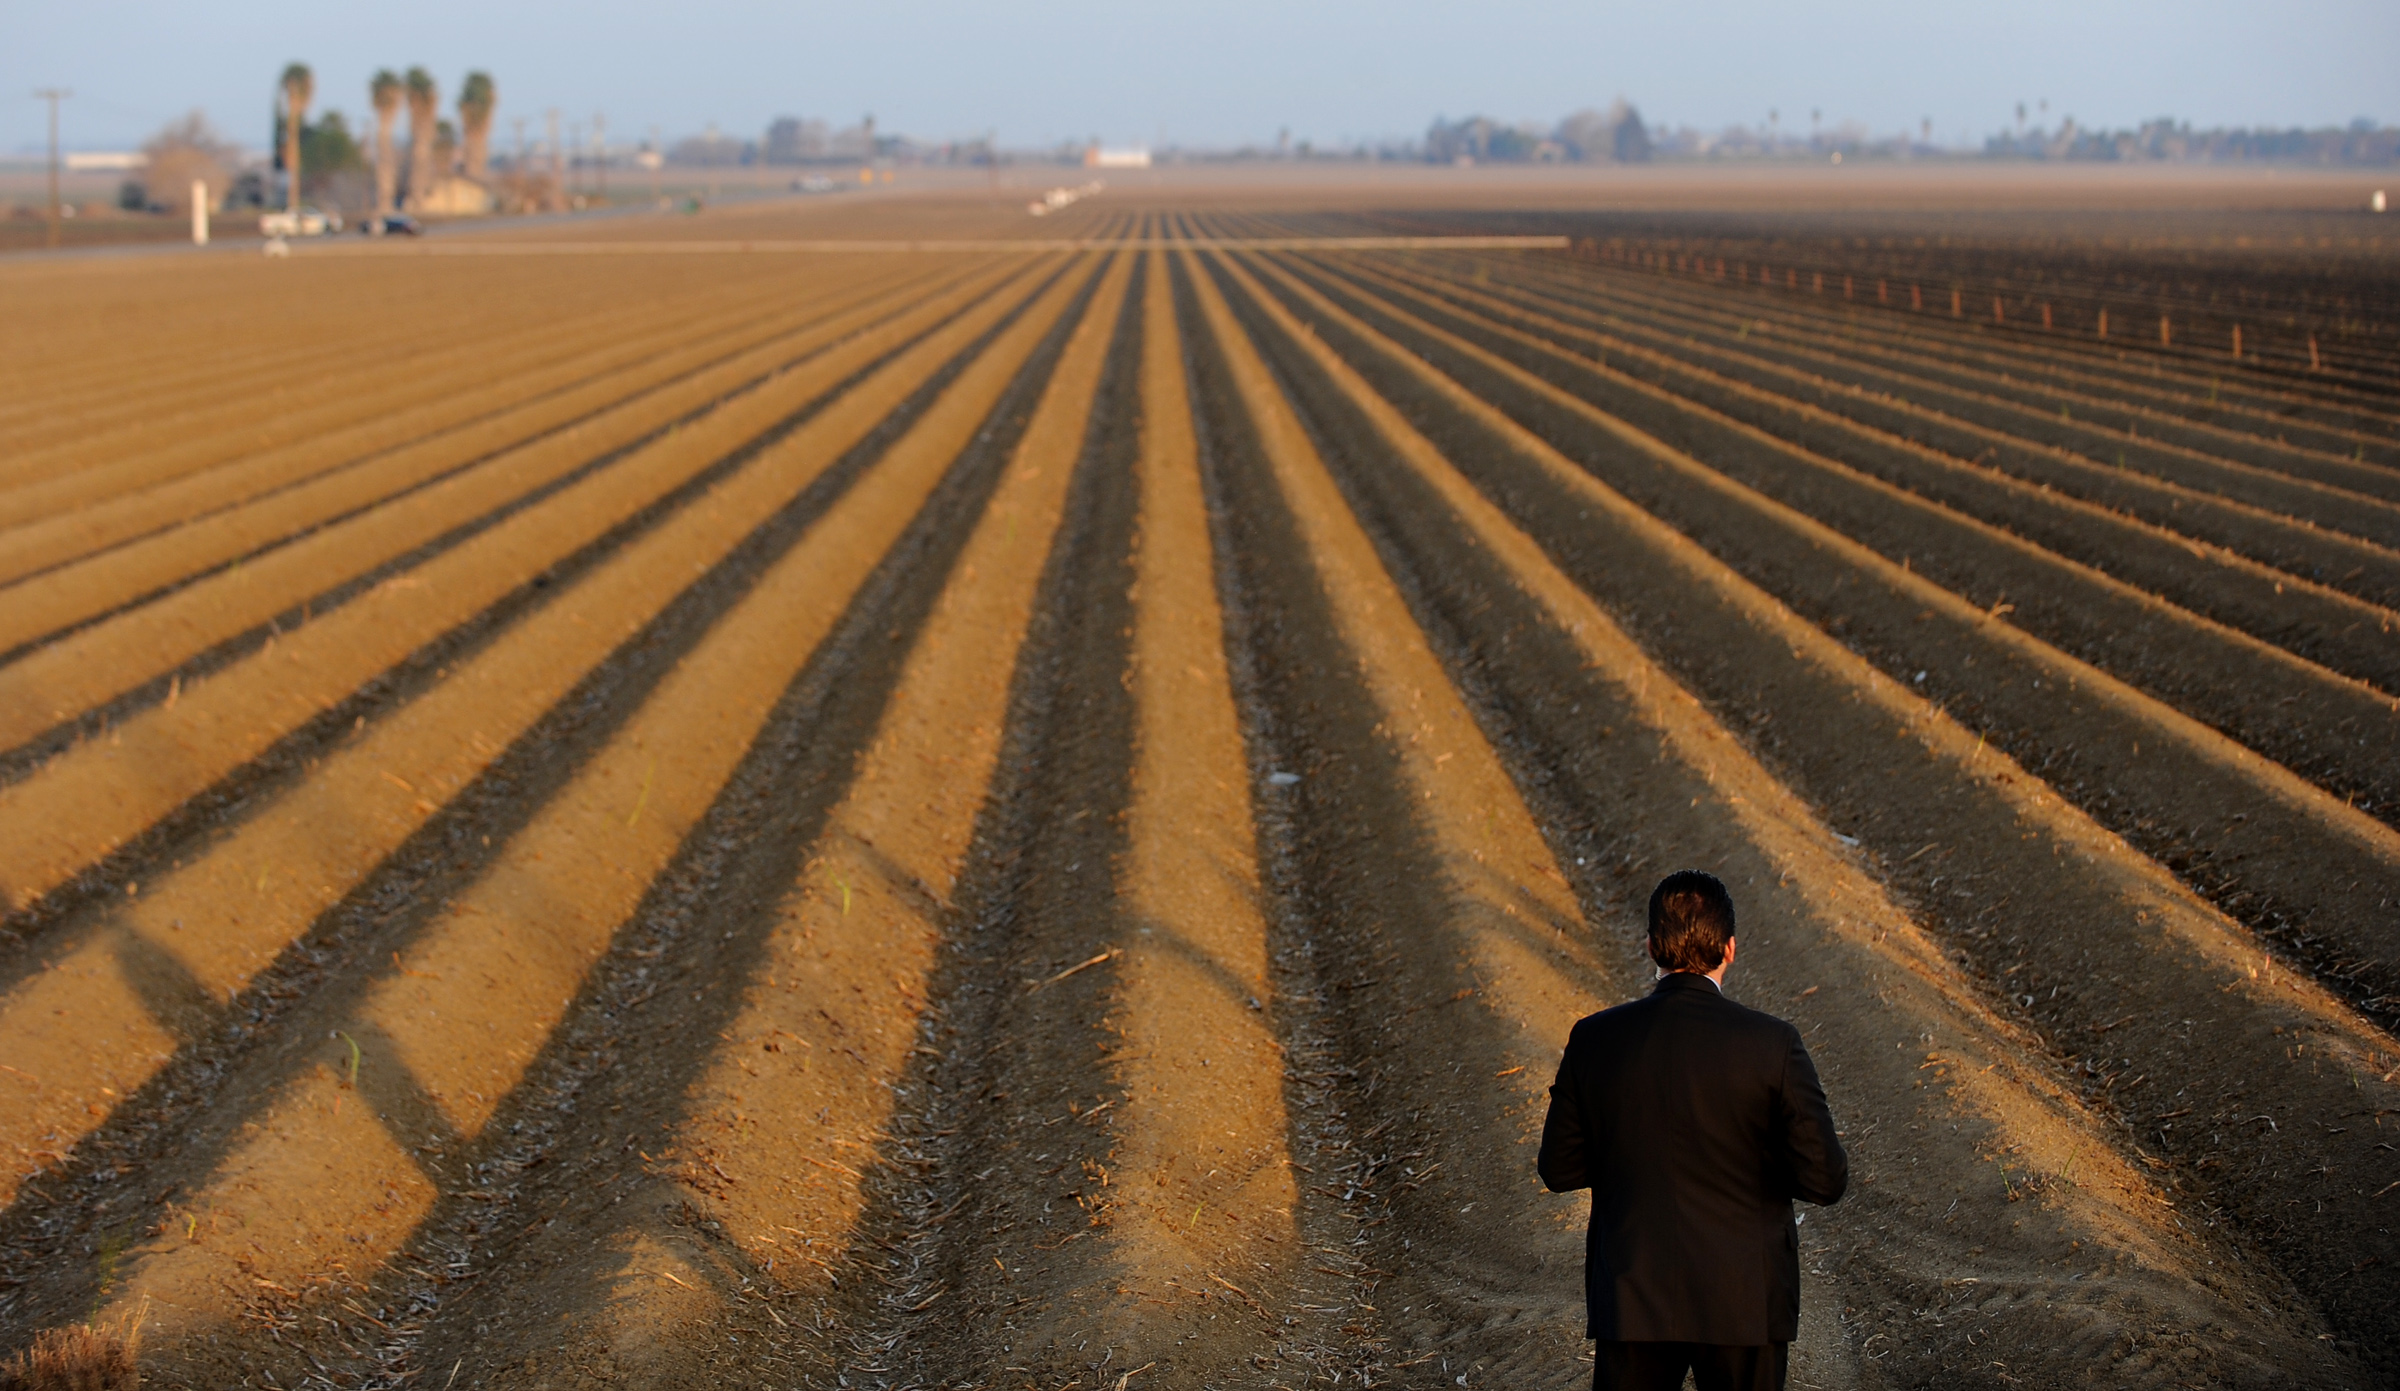
Hopeful Californians are looking to the Pacific this winter for an end to California’s most punishing drought on record.

The reason: what appears to be a monster El Niño in the making. The abnormally warm waters along the equator could mean a wet winter.

There are no guarantees, but there have been portents. On one Saturday in July, San Diego got more rain than it got the entire month of January.

That same month, ESPN broadcaster Dan Shulman broke the news to baseball fans from underneath a golf umbrella: “For the first time in 20 years, a game has been postponed because of rain here in Anaheim.”

You can thank Dolores for that, a hurricane that managed to make it farther north than normal. The intense Pacific hurricane season bears the fingerprints of El Niño, which is already getting hyped as a potential drought-buster.

“Yes, and deservedly so,” says Kevin Trenberth, a Distinguished Senior Scientist at the National Center for Atmospheric Research in Boulder, Colorado.

“For this time of year, the El Niño is as strong as it’s ever been.”

Print
Storms headed for the California coast run into the Ridiculously Resilient Ridge, represented by the “H” in this graphic. (David Pierce/ KQED)

Strength in this case is measured by how much warmer surface temperatures are than normal, in the tropical Pacific. And this one looks to be about as strong as the legendary El Niño of 1997-98, which was the strongest on record, peaking at about 2.3 degrees Celsius above normal.

In the ocean, a spike of more than two degrees is like sticking a hot poker into the climate system. Pacific storms sucked up moisture from extremely warm equatorial waters and pretty much dumped it on California. San Francisco got double its normal rainfall that year.

Enter the Blob

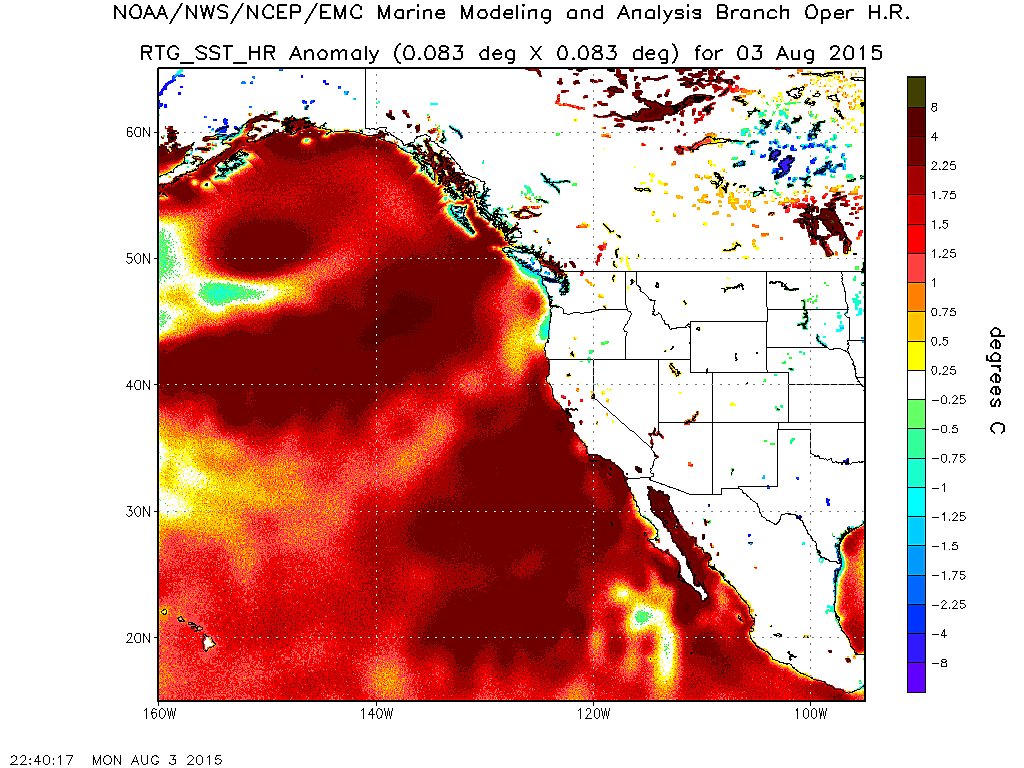
But this time around, there are other things brewing in the Pacific: patches of freakishly warm water spread far and wide, up the California coast to the persistently warm vortex, hundreds of miles across, christened by climate scientists as “the Blob.”

“That is definitely the wildcard with this El Niño,” warns Bill Patzert, a climatologist at NASA’s Jet Propulsion Lab in Pasadena and an advisor to federal El Niño forecasters.

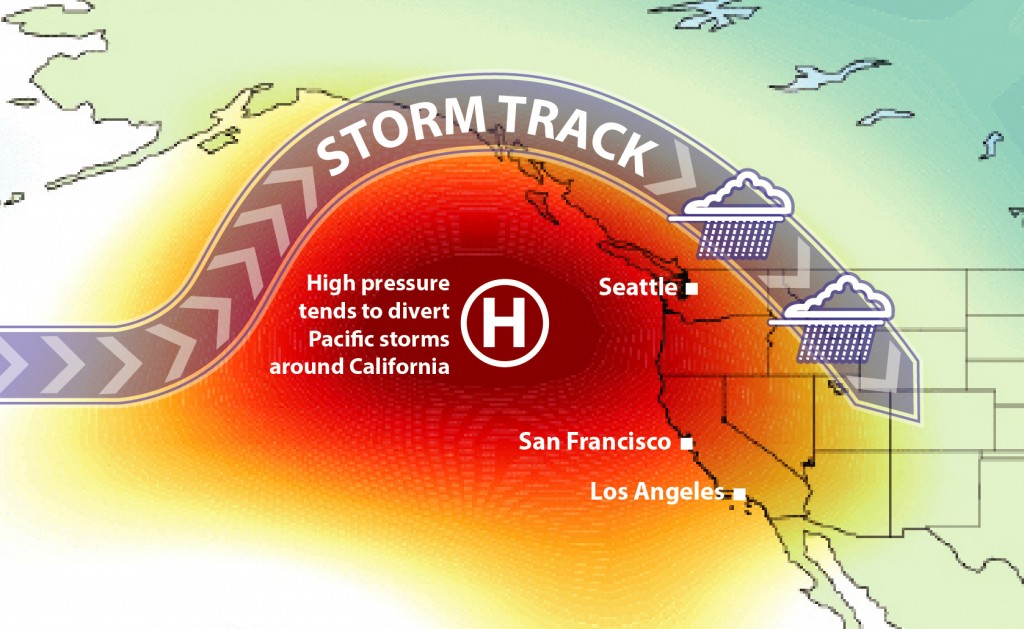
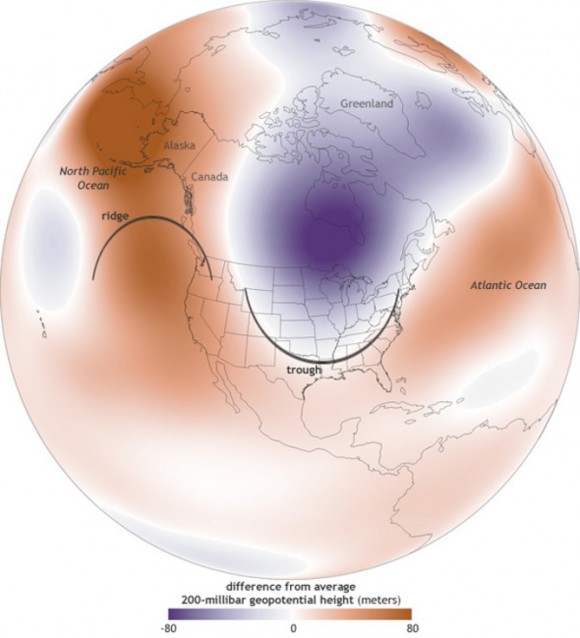
He says unlike in 1997, the Blob has been a fixture during the current drought. It’s essentially the sidekick of that “Ridiculously Resilient Ridge,” the stubborn bubble of high-pressure that’s been parked off the north coast for the past couple of years, diverting winter storms up and around California.

The "Blob" is associated with the persistent ridge of high pressure that has detoured the winter storm track around California.
The “Blob” is associated with the persistent ridge of high pressure that has detoured the winter storm track around California. (NOAA)

“And so the question is, who wins in the battle of the Blob and the El Niño,” says Patzert, “and what impact that’ll have on rainfall on the West Coast of the U.S. this fall, into the winter.”

Patzert says if the Blob and its ridge dominate, we could wring less water out of this El Niño.

“What we’re having here is battling blobs!”

But not everyone’s on the edge of their seat.

“It doesn’t fit with my concept of how things work,” says Trenberth. On the contrary, he maintains, the presence of all this warm water — especially close to the coast — could mean heavier rains from the storms we do get.

A Mixed Blessing

“The potential in California for rains to be torrential this winter is quite high because of the warm water,” Trenberth says.

That’s because, as a general rule, the warmer the water, the more moisture gets picked up by the atmosphere and by any emerging storms.

Ocean waters near California have warmed further in recent weeks, and remain far above normal.
Ocean waters near California have warmed further in recent weeks, and remain far above normal. (NOAA RTG)

“Those storms are apt to pick up moisture from any warm water that’s lying around all along the West Coast,” says Trenberth, “and it just feeds those storms.”

That would be both good and bad news. While the reservoirs refill, the rivers could easily overfill, causing flooding and landslides — much like in 1997-98. Trenberth will take that glass as half-full.

“The way things are shaping up it sure looks like an end to the drought to me,” he says, “depending on how you define the drought.”

Patzert agrees the current El Niño is looking like a monster — “Godzilla,” to use his favorite moniker. But he’s concerned the Blob and its ridge could become at least partial spoilers, blocking out storms from the northern Pacific, leaving the door open only for El Niño-driven storms from the tropics.

That could mean Southern California gets a soaking, but the northern part of the state — where most of the major reservoirs are — misses out.

“There is almost certainly going to be a dividing line,” says Stanford climate scientist Daniel Swain. “And it’s possible that dividing line could occur somewhere in Northern California.”

Patzert hopes that isn’t the case.

“If that happens, I’m definitely going to have to go into witness protection,” he frets, “because ‘my’ El Niño, the Great Wet Hope, will only deliver half the package.”

Whatever we get, it’s a package that won’t be delivered for at least three months, when California’s long-awaited “rainy” season is due.


Cal Fire Chief’s Nightmare Scenario

$
0
0

It comes down to this: the next couple of months.

Lately Northern California has captured national headlines with fast-moving blazes such the Rocky and Jerusalem Fires in the coast ranges about 100 miles north of San Francisco.

Unlike many epic fires in the California record, which were largely driven by wind, in the fires burning north of the Bay Area, “There really is no signifcant wind,” says Cal Fire Director Ken Pimlott. “It’s all being driven by the condition of the vegetation.”

Which is to say, not merely dry, but four-year-drought dry. Pimlott says Cal Fire measures the potential burn intensity of vegetation throughout the state, and is currently seeing “record levels” of that metric, known as the Energy Release Component.

“It’s just creating explosive growth rates,” he says.

The Jerusalem Fire went from 100 to 5,000 acres almost overnight. But the worst may be yet to come.

As summer gives way to fall, the winds typically shift and dry winds from the east sweep across California, turning an already sizzling fire season into a potential blast furnace.

“As we get into late summer and early fall, not only are we still seeing the potential for extreme fire behavior in Northern California, and the potential for a large number of fires like we’re seeing now,” says Pimlott, but “we also get into that peak window for Southern California with Santa Ana winds.”

Similar winds known as Diablos kick up in the northern part of the state.

“And so the state, literally, is really primed right now to have multiple fires going on, north to south.”

In this interview with KQED, Pimlott talks about fire behavior, busting budgets, boots on the ground, and his confidence in the state’s ability to confront an ever-expanding fire season.

We start with what crews on the fire lines are saying about these aggressive, fast-moving fires in the north state:

Dude, Where’s My Earthquake Warning System?

$
0
0

One year ago, in the pre-dawn hours of a Sunday morning, thousands of people were jounced out of their beds when a magnitude-6 earthquake struck the Napa Valley. The shaking claimed at least one life, injured more than 200, and brought down whole sections of buildings in Napa and Vallejo.

For years Californians have been hoping for some kind of warning system that would provide even a few seconds to prepare. Japan has it. Mexico has it. But don’t expect to see it in California for a while.

“It’s a big project,” says Jennifer Strauss. She and her coleagues at UC Berkeley’s seismology lab working with several universities, and state and federal agencies on ShakeAlert, the prototype system for California’s first statewide warning system for earthquakes.

“That’s the goal of the ShakeAlert project for all of us involved,” says Strauss. “We want it to be just a thing that everybody has in their daily life as part of preparedness and safety.

But two years after state lawmakers passed a law authorizing the project, we are far from that goal.

Obstacle 1: Getting the Word Out

“The technology is getting here,” she says, “but it’s figuring out how to move beyond the academic exercise of, ‘Is this scientifically possible?’ and moving into the realm of, how do you get an alert to people?”

That’s proving to be the bigger challenge. The “Amber alert” model, where it instantly goes to everybody’s cell phone turns out to be more of a technical challenge with earthquakes.

A nearer-term goal is getting an operational version into hospitals and businesses where even a few seconds notice could save lives, not to mention millions of dollars.

Obstacle 2: Money

Building out the system is estimated to cost at least $80 million. That seems like a trivial sum given that a magnitude-6 quake in Napa caused five times that in damage. But Senator Alex Padilla’s bill from 2013 didn’t provide any government funding. Some federal assistance has trickled in, and state officials are looking for private partners to help fund the system.

For now, ShakeAlert remains in its beta phase, being tested by selected institutions. A program installed on personal computers includes a visual and audio alert (“Earthquake! Earthquake!”), announces how intense the shaking is likely to be, and provides a countdown in seconds. When the earth moved in the Napa Valley, testers in Berkeley got about ten seconds of warning before the first rumbles arrived. The farther from the epicenter, the more notice it provides.

ShakeAlert offered about 10 seconds of warning to testers in the East Bay. Those "right on top" of the epicenter would likely have less warning.
ShakeAlert offered about 10 seconds of warning to testers in the East Bay. Those “right on top” of the epicenter would likely have less warning. (Erol Kalkan / USGS)

Obstacle 3: Accuracy

But it’s not perfect. As it stands right now, Strauss says ShakeAlert is about 90 percent accurate — that is about one in ten alerts may be a false alarm.

“You don’t want an alert going out and have no shaking, as much as you don’t want shaking with no alert,” warns Timothy Strack, who chairs the state’s Seismic Safety Commission, and is on the steering committee for the warning system. He says even 90 percent reliability probably won’t pass muster with policymakers who will need to sign off on the system.

“We can’t have that with an early warning system for earthquake because we need the system to have credibility so if it alerts, it’s coming,” he says.

Eliminating false alarms is just one of multiple technical challenges yet to be overcome. Strauss says the number of sensors around the state, now numbering about 400, needs to more than double in order to provide a reliable system.

“In California the geography, compounded with where we like to put all our people, makes this very tricky,” says Strauss. “You need very fast telemetry, you need very fast processing speed, you need very fast communications in order to warn people who are sitting directly on top of a fault.”

Obstacle 4: Bureaucracy

Every Californian knows it’s coming, the Big One or “a” big one. They just don’t know when. Nor does anyone seem to know when a workable statewide warning system will be ready for prime time.

“I wish I could guess,” says Strack.

“We need to take that next step to engaging the public and local government, water districts, to see what they really feel is best for an early warning system.”

Strack says that day when all Californians can have it on their cell phones: we’re no closer to that than when the Napa quake struck, one year ago.

NASA: Rising Seas About to Catch Up With the West Coast

$
0
0

Rising Seas are about to become a bigger issue for the West Coast, according to scientists.

Using satellite and other data, NASA scientists have been tracking rising sea levels around the world. They say that natural cycles in the Pacific have been masking effects of sea rise for about the last 20 years. But that’s changing.

“In the next five or ten years, I think the west coast of the United States is going to catch up,” says Josh Willis, a climate scientist at NASA’s Jet Propulsion Lab in Pasadena. He says a major ocean phase known as the Pacific Decadal Oscillation is in the midst of a big shift.

For about the past two decades, the PDO, which Willis describes as “El Niño’s bigger, slower, brother,” was “piling up” warmer water on the far side of the ocean, exacerbating sea rise there. When water warms, it expands.

“So we’ve actually seen a slight drop in sea levels off of our coastline  because of the rearrangement of heat within the oceans,” Willis explains.

That rearrangement could mean an acceleration in the rate that seas rise long the West Coast, eventually overtaking the pace of sea level rise on the East Coast and elsewhere.

“We could be looking at rates in the eastern Pacific two or three times as high as the global rates in the coming years,” says Willis. “So we could be in for wild ride over the next 20 years or so.”

As KQED and San Francisco Public Press have reported recently, billions in shoreline development in the Bay Area are in the planning stages or already begun, despite scientists’ warnings about rising seas.

Scientists say the brewing El Niño will also pile up warm water along California, making coastal flooding that much more likely, very soon. The warm water along the Equator that largely defines El Niño is expected to rival or surpass the legendary “Godzilla” El Niño of 1997-98 in strength.

NASA says global sea levels have risen about eight inches since the beginning of the 20th century and more than two inches in the last 20 years. Though simple thermal expansion of the water accounts for about a third of the rise so far, climate scientists expect melting glaciers and ice sheets to play a much larger role in coming years.

California Cities Squeezed Out More Water Savings Again in July

$
0
0

Urban Californians stepped up to the plate again in July, beating Governor Jerry Brown’s statewide mandate for 25 percent water savings.

“We’ve got a lot of people hitting home runs,”  said Felicia Marcus, who chairs the State Water Resources Control Board, and is sometimes referred to as California’s “water czar.”

Across the state, urban water agencies cut total water use by 31.3 percent, compared to July in  the benchmark year of 2013.

State officials conceded that freak July rains probably helped the cause, as some homeowners turned off lawn and garden sprinklers, at least temporarily.

Hover over the dots to see July conservation numbers:


Water Board staffers  called out a few Bay Area cities for their standout performance, including Menlo Park, which has effectively halved its water use since May, and San Francisco, which has whittled its daily use down to an average of 40 gallons per person.

On the flip side:

“We’ve got a few people who are striking out or not able to find the ball park,” said Marcus, rolling with the baseball metaphor, “and we need to focus on them.”

Most of the laggards continue to be in the Southland, especially in more arid regions. But Water Board officials said only four agencies in the state missed their assigned savings quotas by more than 15 percentage points. The quotas, or “tiers,” range from 4 to 36 percent. No agencies have yet incurred fines for missing their marks.

June was the first month in which water agencies had to meet their assigned conservation quotas and the numbers showed that most of them stepped up to the challenge. About four out of ten urban water suppliers cut their water use dramatically, by 30 percent or more.

About a third of water districts, 140 in all, fell short, mostly in Southern California.

Listen to the story:

Overall, Californians saved 27.3 percent in June, compared to June of 2013, exceeding the 25 percent statewide mandate issued by Governor Jerry Brown on April 1. A year prior to that, Brown had called for a 20 percent cut in water use through voluntary action and the results were hugely disappointing, yielding less than half that in savings.

The Brown mandate applies only to urban water use, which includes most commercial and industrial applications. Urban water consumption accounts for about 10 percent of the total water used by Californians. Agriculture, which takes by far the biggest slice, is under a different system of restrictions.

Map produced by Lindsey Hoshaw.

Why the Worst of Fire Season May Lie Ahead

$
0
0

As bad as things are already, the system in place to manage California’s wildfire season is already “stretched very, very thinly,” according to Mark Ghilarducci, who directs the state’s Office of Emergency Services.

“The fire season itself has probably been the most extreme that I’ve seen in my 30 years,” said Ghilarducci in a state-produced video interview on Tuesday.

And it’s not over. In fact, it could get worse, for three main reasons:

We’re still in a drought

The “rainy season” is still a good six weeks away though don’t tell L.A. residents who got a surprise drenching of nearly two inches of rain in one morning this week. The Southland has seen other freak rains this summer, which washed out a freeway overpass and forced the first Major League Baseball rain-outs in two decades. Those were shards from an active Pacific hurricane season, probably linked to El Niño.

But the light rain that fell near the Valley Fire on Monday, never even made it to the ground, according to officials on the scene. In fact, preliminary research at San Jose State University’s Fire Weather Research Lab suggests that the virga actually made matters worse on the ground.

“The rain that we saw in Southern California notwithstanding, it certainly hasn’t rained like that up north and even in the south it will dry out quickly,” warns Stanford climate scientist Daniel Swain.

“California is still experiencing really severe drought conditions and we definitely have a few more months before we see substantial relief.”

Swain says that even if the current El Niño conditions in the Pacific turn out to be a major rainmaker, California is not likely to see the peak effects until December or January. Meanwhile, each passing week without substantial precipitation increases evaporation, baking out what little moisture remains in soils and setting the stage for more severe wildfires.

Changes in the Wind

Some of California’s most aggressive fires are driven by what scientists call katabatic winds, better known as Santa Anas in Southern California, Diablos in the north.

In the fall, the usual onshore breezes start backing around and dry easterly winds roar through mountain passes, speeding up and heating up along the way. This season, some fires have behaved like classic Santa Ana-driven fires — without the winds.

The devastating Valley Fire north of the Bay Area stunned firefighters, blowing up to 40,000 acres in one day.

“The fire would throw embers a half-mile beyond where firefighters were working, said Cal Fire spokesman Daniel Berlant.

“This is the kind of fire we would see with Santa Ana winds but in our area, this is unprecedented.”

High Temperatures Will Up the Ante

Add to the mix the abnormally high temperatures that have persisted this summer, often at the most inopportune times, such as the early days of the Valley Fire.

“This late-season heat really sort of sets the stage for any big offshore wind events—these Santa Ana or Diablo winds that often occur later in the fall,” warns Swain.

2014 went down as California’s warmest year on record and 2015 is on track to beat it. According to NOAA, the statewide average temperature was slightly above normal in July, then spiked to nearly 3 degrees Fahrenheit above the 20th Century average in August.

Some of the state’s most catastrophic fires have broken out in October, including the historic Oakland Hills firestorm, which destroyed more than 3,000 homes in 1991.

“All the vegetation is drought-stressed and especially dry given the heat wave, and so if and when we get these big wind events over the next couple of months, that’s probably going to lead to some big problems,” says Swain.

How El Niño Might Have Fed the Valley Fire’s Strange Ferocity

$
0
0

Researchers at San Jose State have a theory that could explain the wind-driven explosive growth of the Valley Fire, and as strange as it sounds it’s … a hurricane.

Strengthening El Niño conditions have spawned an active Pacific hurricane season. Just as the Valley Fire was getting started, a dying hurricane named Linda was still pumping moist air into the upper atmosphere, well north along the California coast.

“And it’s really the mixture of those two air masses — the moist air aloft and the really dry air near the surface — that led to the development of these winds,” says Neil Lareau, a researcher at the university’s Fire Weather Research Lab and co-author of the article appearing on the lab’s website.

“Cooler air is actually denser than warmer air,” he explains. “So when you cool the air, it tends to sink towards the surface, and it also tends to develop higher pressure.”

That high pressure building just off the coast created a “burst of northwest winds” that bedeviled firefighters with 35 mph gusts.

When Wetter Isn’t Better

The rain that never made it to the ground (known as virga) in the fire zone actually made matters worse, in Lareau’s analysis. Evaporating raindrops rapidly cooled the upper-level air,  which created a downdraft that increased winds locally.

While Lareau’s article is not based on any formal peer-reviewed study, he writes that there is “clear evidence that tropical moisture contributed to enhanced northwest winds that propelled the fire.”

When the fire was in its most explosive growth phase, fire officials marveled at how the blaze seemed to leapfrog attempts to subdue it.

“The fire would throw embers a half-mile beyond where firefighters were working,” said Cal Fire spokesman Daniel Berlant.

“This is the kind of fire we would see with Santa Ana winds but in our area, this is unprecedented.”

Lareau has an explanation for that, too. He says the same bizarre set of meteorological conditions caused the usual upward column of hot air to tilt.

“And then all of those embers that would’ve been going straight up in the plume get ejected out in front of the initial fire,” explains Lareau, “causing new fires to form in this kind of hopscotch fire growth across the landscape.”

Lareau says it’s hard to tell what implications this has for the remaining fire season. The likelihood of similar events might depend on what other storms are spun out of the tropical Pacific by El Niño.

California Drought Revives a River — and a Poignant History

$
0
0

California’s relentless four-year drought has had some unexpected consequences. It’s uncovered lost bits of history — ancient petroglyphs and remnants of mining towns at the bottom of reservoirs.

And in the canyons of the Sierra foothills, the legendary rapids of the Stanislaus River are back.

The Stanislaus feeds New Melones Reservoir, about 80 miles east of the Bay Area — except that lately it hasn’t been feeding it much. The reservoir, which holds water for the federally operated Central Valley Project, has dropped to just over 10 percent of capacity. It’s receded so much that some of it has reverted to flowing river, exposing rapids that disappeared when the Army Corps of Engineers erected a 600-foot-high dam, nearly 40 years ago.

“Look above us now,” Mark Dubois called out from the stern of a yellow inflatable raft. “Look downstream, you can see 40 feet above our heads would be reservoir in full season.”

Listen to the story:


Mark Dubois started running this river as a teenager. Now in his mid-60s, his bearded, 6-foot-8 presence is still bigger than life. He became world famous briefly in 1979, when he took a bold — some would say, reckless — stand to save this stretch of river from being submerged by the new dam.

“I’ve been groping all those years and every year since to describe the magic of every square foot of this river and what it does to people’s lives,” he says, “and I still have no words for it.”

But in 1979, when Dubois was 30 years old, he did have a kind of epiphany. After years of protests and political action, it looked like he and his fellow activists had run out of options for stopping the canyon’s inundation, and the new, expanded reservoir was about to be filled.

Four years of drought have exposed standing forests that were underwater and "bathtub rings" that mark previous levels of the New Melones reservoir.
Four years of drought have exposed standing forests that were underwater and “bathtub rings” that mark previous levels of the New Melones reservoir. (Craig Miller/KQED)

“In that moment I had no idea what I was going to do,” he says, “but I knew that in that moment, I couldn’t just turn away.”

So Dubois went down to the hardware store, bought some chain, and shackled himself to a canyon wall at a secret spot on the river’s edge — one that he knew would soon be underwater. He padlocked the chains and tossed the keys out of his reach.

I asked him if he was actually prepared to go under.  His thoughtful one-word reply: “Yeah.”

The move had been kept under close wraps. Dubois knew every corner of the canyon and was so well hidden that after several days of searching, officials suspected a hoax. But it was real, and Dubois’ act stunned even many of his fellow activists.

Gina Cuclis, who worked on the Save-the-Stan campaign as a college student, remembers her reaction when someone handed her a newspaper in late May of ’79.

“Oh my god — look what he did!,” she recalls thinking. “And then it was stunned and shocked, but then it was like, wow. Wow.”

She recalls that at the time, she was nervous on Dubois’ behalf, but never actually feared for his life.

“I was glad he did it because it was the big event we needed,” Cuclis says. “How do you get attention? You gotta do something shocking, sadly.”

“I didn’t do this wanting to commit suicide,” says Dubois. “I wanted them (the Army Corps of Engineers) to choose. It was: You are consciously deciding to flood all the life in this canyon. Now you can choose to flood one more life.”

Newspapers followed DuBois' showdown with the U.S. Army Corps of Engineers, which was preparing the flood the river canyon.

At the time, the Stan was wildly popular among rafters and kayakers. It was the closest thing California could offer to a Grand Canyon-type of experience: towering limestone canyons and Class III whitewater — rapids with “inviting” names like “Death Rock” and “Widowmaker.”  But for all the morbid imagery, it was the life of the river that attracted Dubois — and cemented his resolve.

“You know, turquoise waters dancing around,” he recalls. “The butterflies were dancing, the dragonflies were coming, the grapevines were reaching out, the wildflowers blooming, and in a moment, I just felt the life of that place.”

A few fellow activists joined Dubois in literally chaining their fates to the river canyon. The governor — Jerry Brown, as it happens — sent a plea to President Jimmy Carter to stop the filling.

It worked, for a while. After a week in the canyon, Dubois came out with a deal in place to preserve at least part of the river, by filling the reservoir only partway. They managed to delay the flooding for a year, but ultimately the waters came, driven by the pressure for more irrigated land and the torrential El Niño rains of 1982.

The nine-mile stretch of river, so beloved by so many, disappeared, bubbling back up only now that severe drought has exposed not only the rapids, but the memories and the grief.

“Losing a place you love is like losing a person you truly love,” says Cuclis. “It’s not a person but when it’s a place that has touched you, changed you, you feel a deep loss.”

Today, the river offers only faint shadows of what was; the canyon walls are scarred with high-water marks known as “bathtub rings,” and groves of skeletal Ponderosa pines, submerged for decades, still stand a ghostly vigil near the riverbed, newly exposed by receding waters.

As the same punishing drought revives the call for more water storage — and to some that means more dams — some of the new generation of activists have returned to the Stan for inspiration.

“I needed to see this place for myself. I needed to come see this,” said Eric Wesselman. He’s the current head of Friends of the River, a job that Dubois himself held when the organization was just getting started.

“I’ve studied the campaign,” he told me as he was preparing to run the river with Dubois and a coterie of river enthusiasts. “Organizers like me yearn for the opportunity to be part of campaigns like that because they’re special and they’re magical and so powerful and great things can happen.”

Things did happen. There’s little doubt that the Stanislaus campaign supercharged a national movement to save wild and scenic rivers, probably sparing the nearby Tuolumne River a major dam project.

But for Dubois, the gains are still hard to balance against what was lost. Even today, he gets choked up contemplating it. He knows that, soon enough, rain will return and his lost world will again vanish beneath the waters of New Melones Lake.


Californians Take Drought Lessons From Down Under

$
0
0

Listen to the Story:

Australia has become a crossroads for California policymakers seeking clues to coping with long, arduous droughts.

A group of state lawmakers led by Senate President Pro Tempore Kevin de León spent the last couple of weeks Down Under.

“Australia is well-positioned to handle the next, inevitable drought,” said Senator Ben Allen in a statement following the trip. ” California would be wise to take a similar long-term approach,”

Felicia Marcus agrees. She heads the State Water Resources Control Board and crossed paths with legislators on her second fact-finding trip to Australia as the state’s top water regulator. Marcus has long admired the Aussies’ cooperative, “can-do” attitude toward water issues and wouldn’t mind seeing a little more of that here.

“I think we have the can-do attitude,” Marcus told KQED on her return. “We just spend a lot of our time fighting in a system that’s very adversarial.”

So given those differences, how much of the “drought-proofing” that Australia’s done could really work here in California?

“I think there’s a lot of lessons we can learn,” says Matthew Heberger, a water analyst at Oakland’s Pacific Institute. He’s written extensively about the Australians’ own revelations during the millennial drought that lasted from nine to twelve years, depending on how you measure it. That’s something that hasn’t happened in California for at least a century. (There were two six-year droughts in the 20th century.)

Heberger says the Big Dry inspired major changes: “Lots of initiatives to capture runoff and infiltrate it into the ground, where you can later use it for water supply,” he notes, “not allowing stormwater to just run off into the sea.”

The Big Dry was the worst drought in Australia’s history. It devastated the farm economy (at one point halving the number of sheep, the nation’s principal livestock) and triggered severe restrictions on urban water use. It also transformed the water culture in that country — and much of it stuck.

“Absolutely,” says Rebecca Nelson, a Melbourne-based research fellow at Stanford’s Woods Institute for the Environment. “The ethical and moral dimension of water use, I think really built during the drought.”

Many Australian homes now have rainwater capture systems.
Many Australian homes now have rainwater capture systems. (Albert Barlow/Rain Water Systems)

“They have a practical and pragmatic mentality about how to get things done,” adds Marcus. “They think more as a community. I find it inspiring.”

Urban Water Use

“We had here a phenomenon that people called ‘bucket back,” Nelson says, describing the back strain Aussies would suffer from catching the excess shower water in buckets and hauling it outside to water the garden — an affliction now endured by many Californians.

Nelson’s hometown of Melbourne gets just about the same average rainfall as San Francisco — about 23 inches a year. She estimates that about half the homes in Melbourne now have systems to capture and store rain, and newer homes are being built with dual plumbing systems to recycle greywater. (For example, rinse water from the washing machine goes to the toilet for flushing.)

Spurred by the Big Dry, residential water use in Melbourne shrank to about 40 gallons per person, per day — including outside watering. Californians still average more than double that, despite unprecedented statewide restrictions on water use.

Desalination: A Cautionary Tale

Australia’s government spent $25 billion on drought countermeasures — that’s three times as much as the water bond that Californians passed last year — for a country with a little more than half the population of California. That ambitious program included a string of desalination plants along the coast, a decision that many question in retrospect.

Map shows vast areas with record-low rainfall during the worst of Australia’s ‘Big Dry.’
Map shows vast areas with record-low rainfall during the worst of Australia’s ‘Big Dry.’ (Australian Bureau of Meteorology)

“Desalination is considered a holy grail by water managers,” says Heberger. “The ocean is essentially a limitless source of water. The problem is that it’s expensive, and it’s energy-intensive to take the salt out of the water.”

Consequently, when the rains returned to Australia, which they did with a vengeance at the end of 2010, desalted seawater could no longer compete price-wise with water that fell from the sky. “And so you’ve got these very expensive projects that have, for now at least, been sort of mothballed,” says Heberger.

That pendulum could swing back soon as historically strong El Niño conditions in the Pacific Ocean threaten drought again in Australia (the opposite of its likely effect here).

Four years into California’s drought, the desal train is gaining speed here. This nation’s largest plant is about to go online in Carlsbad, with at least a dozen more on the drawing board. Nelson says there’s a cautionary tale here: the best decisions for drought planning are not made during the drought.

“I think most ordinary citizens would say it’s fantastic to have a climate-independent source of water,” she said. “But the panic that’s generated during drought, many people say, led the [Melbourne] desal plant to be built many, many more times bigger than it really should’ve been. And as a result, it’s very, very costly, even though it’s not being used.”

A secret service agent looks over a fallowed field near the Fresno County town of Firebaugh, during a February 2014 visit by President Obama to announce emergency drought relief measures.
A secret service agent looks over a fallowed field near the Fresno County town of Firebaugh, during a February 2014 visit by President Obama to announce emergency drought relief measures. (Wally Skalij/AFP/Getty Images)

Agriculture

There are many parallels between here and there when it comes to water. In both places, most of the water is in the north, most of the people in the south. The rain tends not to fall during the growing season. And Australia’s agriculture — like California’s — uses by far the biggest volume of water, more than two-thirds in Australia, closer to three-quarters in California (of the water available for human use).

And that’s where transplanting lessons gets a little tricky. Here, farm water is meted out by a longstanding — some would say byzantine — system of property rights: junior, senior, riparian, pre-1914, and so on.

“That consideration just doesn’t exist in Australia,” says Nelson. “The way that Australian water law manages scarcity is, if there’s less water around, everybody takes a haircut.” She and Marcus agree, that’s made it easier for Australians to develop an enviable system of water marketing for farmers and ranchers.

“It’s almost as easy to sell water from your water bank account as it is to just transfer money from a normal bank account,” Nelson says.

As more than one observer has put it, Californians tend to settle their accounts in the courts.

So if Australia is a useful laboratory for developing drought resilience, does that mean that California needs its own nine-year drought as a kind of shock therapy?

“I wouldn’t wish that on anyone,” says Heberger. “But it did certainly do a lot to raise awareness. Everyone could tell you, you know, how high the water level in the reservoir is, that people become much more attuned to where our water comes from, that we’re taking it out of the environment and using it. And that has repercussions and an impact.”

Awareness has already proven to be a powerful conservation tool in California’s four-year drought. But long-term “water security” for the Golden State will take political will and compromise — something else that is often in short supply.

This is an updated version of a post that first appeared on June 30, 2014.

Warm Temperatures Boost California Water Use in October

$
0
0

Heat is a brutal enemy to water conservation.

Officials say the unusually high temperatures in October threw a wrench into water savings, the statewide conservation rate slipping to 22.2 percent, measured against the same month in 2013.

It was the first time in five months that urban water savings statewide fell short of Governor Jerry Brown’s 25 percent conservation mandate.


Hover over the colored dots to see how individual water agencies are performing under the state’s assigned conservation quotas.

Still, the state’s top water regulator called it “pretty good news.” Felicia Marcus, whose State Water Resources Control Board oversees conservation efforts says she’s “relieved,” given how much worse the numbers could’ve been.

Water board staff scientist Katy Landau called October, “a bit of an odd month,” wetter than October in the base year of 2013, but also 7 degrees warmer on average, statewide. The warmer the weather, the harder it is for homeowners and businesses to resist starting up the sprinklers.

Overall, however, records supplied by more than 400 water suppliers around the state show that California is on track, with unprecedented water restrictions having reduced cumulative water consumption by 27.1 percent, still ahead of Brown’s 25 statewide mandate.

Graph showing monthly water conservation rates statewide
In Northern California, water agencies in Contra Costa County, Pleasanton and Livermore were lauded by regulators as standout performers, all being at least 10 percent ahead of the conservation quotas assigned to them by state officials.

Throughout the five months that the mandatory conservation program has been in place, Landau says that Californians have managed to save a volume of water large enough to supply one year’s worth of the residential needs of San Diego and Sacramento Counties combined.

Regulators have sent “conservation orders” to some laggard agencies. Among those, Landau says most have shown improvement, but eight out of nine are still falling short of their assigned savings marks.

The sweeping array of emergency drought restrictions that Brown put in place in the spring, run through February, though they can be extended “if drought conditions persist” through January. Marcus says, “They will,” regardless of how much precipitation the state gets in the meantime.

As if to underscore the point, on Tuesday officials told cities and farms served by the State Water Project to expect 10 percent of their hoped-for water deliveries this coming year. This is only the “initial allocation,” and could well be revised upward if California has the wet winter that’s been predicted.

‘Water Czar’ Disputes Poor Grades for California’s Drought Response

$
0
0

A “report card” for California’s response to the four-year drought is being greeted with some consternation by state water officials.

“One always prefers ‘atta-boys’ to kicks in the pants,”  responds Felicia Marcus, one of the state’s top water regulators.

On Monday, the Natural Resources Defense Council issued a report grading efforts to cope with the current dry times and gird the state against future droughts. It was a report card that, if handed down by your fifth-grade teacher, you probably wouldn’t be eager to show your parents.

The report issued D grades for conservation in the farm belt and for capturing and recycling stormwater runoff, and an F for its efforts thus far to restore and protect the Sacramento-San Joaquin Delta, widely considered the keystone in California’s water system.

“I think it comes down to setting clear goals and putting regulations in place to ensure those goals are met,” says Kate Poole, a senior attorney for NRDC, “and then providing the funding and assistance to meet those goals.”

The report assigned higher grades to some of the state’s efforts: a B for its urban water conservation program, and B- for use of recycled and reused water.

“While the state is making significant progress in a couple of those areas,” says Poole, “it’s really fallen down on the job in a few of them.”

The NRDC "report card" grades California in five broad areas of water management.
The NRDC “report card” grades California in five broad areas of water management. (NRDC/Thirsting for Progress)

Marcus, who chairs the State Water Resources Control Board, says she would like to have seen the NRDC give more credit for last year’s landmark groundwater legislation, which will pave the way for the first regulation of groundwater pumping in California’s history. She sees this drought as a pivot point in attitudes toward water — but also a starting point.

“We’ve tried to lay a foundation for the future,” says Marcus, whose board was not the sole target of the critique. “I think we’ve actually been able to advance the cause of sustainable water considerably, even while in the midst of of the drought. But the work is far from over.”

Marcus cites “hundreds of millions of dollars” in low-cost loans and streamlining of rules to make water recycling easier for local water agencies.

“We’re gonna end up with a lot more recycled water in just a few years,” she predicts. “But that’s not ‘snap your fingers, make it happen.'”

So how would Marcus grade the state?

“I think we get an A for effort,” she says, “and probably a B in execution, because you can’t get it all right.”

Move Over, ROY G. BIV: Rainbows Get a Makeover

$
0
0

Can anything new be said about rainbows? Certainly, from an artistic or literary standpoint, the possibilities seem endless. But in science as well, new ground is being broken into the nature of these enchanting symbols of hope in the sky.

French scientist Jean Louis Ricard says he’s come up with a new classification scheme that takes into account the sheer diversity of rainbow types out there. Alongside the classic 7-color banded bow (imprinted on generations of school kids by the mnemonic character ROY G. BIV), he has incorporated red bows and yellow bows, as well as rainbows with a variety of added components.

Rainbows are perhaps the best known phenomenon in atmospheric physics, but Ricard, of the National Centre for Meteorological Research in Toulouse, France, found the existing body of research wanting.

“Even though the study of rainbows can be traced back 2000 years they are still not fully understood,” he said at the recent American Geophysical Union in San Francisco.

His new system divides rainbows into 12 types and the insight he’s brought to rainbow science, if there is such a thing, is to define them by appearance rather than by the underlying physics. That may seem a backward approach for a physical scientist, but Ricard notes that doing so actually does incorporate more of the complex physical processes that go into forming rainbows.

Click to view slideshow.

“The strategy here is unlearning what we know about rainbows,” he suggests. “Stop using rainbow models in defining the classes and (instead) define the classes directly from the pictures.”

Rainbows form when sunlight passes through water droplets in the sky, usually left over from a rainstorm or passing shower. Rays reflect and refract (bend) off the droplet as it enters and as it exits, and the colors seen at any given time are a result of how big the water droplets are. For example, the largest droplets give bright violet and vivid green and red streaks but hardly any blue. As the droplets get smaller, more of the colors get washed out until you get mist-bows, which are bands of white in the sky.

Sunset at the Golden Gate Bridge, a red rainbow appears.
Sunset at the Golden Gate Bridge, a red rainbow appears. (Photo: Charles/Flickr)

Ricard said that the textbook explanation of rainbows classifies them based on water droplet size, but there are many other factors that can influence a rainbow. Red or yellow bows can appear at sunrise or sunset and have to do with the low angle of the sun in the sky and the intensity of the light. And rainbows can vary based on the presence or strength of other accompanying bows, known as the Alexander band and supernumerary bows. His new schema assigns rainbows to a type based on a variety of visual characteristics.

He says being more inclusive in this way means you don’t “miss the point that other important physical processes are at work” in the formation of rainbows. Still, he acknowledges that rainbows are fickle and ever-changing. Just when you try to pin one down, a rainbow will slip away or become some new type or maybe even multiple types at once. Perhaps the water droplets at the foot are larger than those at the arch so that the color bands change with altitude — what kind of rainbow is that?

Perhaps their elusiveness is what makes rainbows so appealing on so many fronts, including in science.

“Very often people ask me if [I’ve] found a pot of gold at the end of the rainbow,” Ricard reflected, “and the answer is, ‘No.’ But I have found happiness in the rainbow.”

Supernumerary rainbow: Extra supernumerary arches appear on the underside of this rainbow near Hilo, Hawaii.
Extra supernumerary arches appear on the underside of this rainbow near Hilo, Hawaii. (James Walsh via Creative Commons)


Scientists Track Undersea Noise Pollution as Ship Traffic Swells

$
0
0

Listen to the Story:

When one of the world’s largest container ships passed under the Golden Gate Bridge on New Year’s Eve, it raised the curtain on a new era for West Coast container ports — and raised new anxiety for marine biologists.

Scientists have long been concerned about the impacts of  noise pollution on undersea ecosystems. A wide variety of marine animals, from whales to snapping shrimp, depend on sound to navigate, communicate, and even survive.

“At a very basic level, we know that these animals use sound as we use light,” says Brandon Southall, a marine consultant and research associate at the University of California, Santa Cruz. “It’s their fundamental essential mode of communication.”

While environmentalists have fought epic battles with the U.S. Navy over interference from sonar, Southall says the growth of commercial shipping poses by far the biggest threat to the undersea soundscape, from the noise ships generate simply by moving through the water.

With an overall length of 1,300 feet, the ULCS (Ultra-Large Container Ship) Benjamin Franklin is the biggest ship ever to call at a North American port — 200 feet longer than the Navy’s newest, biggest aircraft carriers.

NOAA scientist Danielle Lipski (foreground) and technicians aboard the R/V Fulmar prepare to deploy an undersea sound-recording station that will capture sounds for two years before floating back to the ocean's surface.
NOAA scientist Danielle Lipski (foreground) and technicians aboard the R/V Fulmar prepare to deploy an undersea sound-recording station that will capture sounds for two years before floating back to the ocean’s surface. (Craig Miller/KQED)

When fully loaded, the Franklin has a draft of 52 feet — it’s like dragging a 5-story building along underwater. That takes giant propellers and a huge amount of power to move. And all of that generates low-frequency noise below the surface.

“Other things in the ocean make sound,” says Southall, “but shipping is the overwhelmingly dominant component of the noise that people put into the ocean in places like San Francisco Bay here, where you have all the ships coming in and out.”

The ship’s operators say the Franklin is designed to be more than compliant with new international guidelines for minimizing ship noise below the water line. But the guidelines are voluntary, and there’s no assurance that other shippers will follow suit, especially in retrofitting older ships.

According to Lloyd’s Register, total tonnage of the global merchant shipping fleet is expected to double by 2030 (v. 2010). That would mean more ships and bigger ships. The number of large container ships could multiply six times, driven by growing populations, rising consumerism and increased global trade.

NOAA is building out a network of undersea listening stations along both U.S. coasts.
NOAA is building out a network of undersea listening stations along both U.S. coasts. (David Pierce/KQED)

In response, scientists are deploying a network of undersea listening stations to develop a more complete “picture” of ocean soundscapes and how they’re changing.

“There’s a lot of noise in the ocean and the oceans have been getting noisier,” researcher Danielle Lipski told me as the NOAA research vessel R/V Fulmar was about to cast off from Bodega Bay in October.

Lipski’s mission on that day was to deploy the newest in a network of underwater listening devices, this one about 20 miles off of Pt. Reyes.

“We know that there are ships and we know that there are whales,” she said, “but we don’t really understand the soundscape there.”

Lipski says sound — especially in the low-frequency range where whales vocalize — can travel hundreds  or even thousands of kilometers underwater, depending on a variety of factors such as the contours of the sea floor, water salinity and even temperature.

Researchers at NOAA’s Pacific Marine Environmental Lab hope this undersea “surround sound” will reveal, among other things, how much noise pollution is being generated by shipping lanes that cut through the Cordell Bank National Marine Sanctuary.

“From that I think we’ll get a pretty good idea of how that sound is affecting the habitat quality of the animals that are in the sanctuary,” Lipski said.

Answers won’t come quickly. The listening station, anchored to the sea floor in more than 1,600 feet of water, cannot transmit, so it will continue recording sounds for two years. Only then will scientists retrieve the hydrophone and begin to analyze what they’ve got.

“Having two years’ worth of data’s gonna be a really rich data set for us to understand the types of sounds that change seasonally and year-to-year,” Lipski told me.

And then, scientists can make recommendations for things like where to expand shipping lanes — and where not to — and fine-tune new international guidelines for making the ships themselves quieter.

NOAA is building out a network of sound-gathering stations along both U.S. coasts.
NOAA is building out a network of sound-gathering stations along both U.S. coasts. (David Pierce/KQED)

Meanwhile, things continue to amp up under the waves. From a whale’s perspective, Southall likens it to living in a city undergoing rapid growth.

“He’s in a place that is loud and dynamic but it didn’t have this whole component of ships, boats, echo sounders — you know, just human presence — in the lifespan of some of these 150-year-old animals,” Southall said. “Their whole environment has gone from a rural area to a busy city, if they live near shipping lanes.”

2015 Was the Warmest Year on Record Globally (But Not in California)

$
0
0

2015 goes into the books as the warmest year the Earth has experienced since 1880, when official records began. And the record was not merely set, but shattered.

Combining land and ocean surface temperatures, the global average for the year was 1.62°F (0.9°C) above the 20th century average, according to data gathered by federal climate scientists.

California_-map_temps copyThe extreme temperatures were evenly distributed worldwide and part of the “long-term trend,” says Gavin Schmidt of NASA’s Goddard Institute for Space Studies, and would have been unprecedented even without the warm El Niño conditions that have prevailed in the Pacific Ocean for much of the year.

Both sea and land temperatures set new highs individually, but land temperatures in particular were way out into record territory, surpassing the previous record of 2007 by 0.45°F (0.25°C).

It’s the fourth time since 2000 that the global temperature record has been broken. Only two months — January and April — did not set temperature records globally, the first time that 10 months of any given year have all set high-temperature marks.

2015 was also the year that Earth officially reached one degree Celsius above  pre-industrial levels (about 250 years ago), exactly halfway to the 2-degree international target established for halting global warming.

California did not set a new mark for high temperatures, contrary to some expectations. 2015 clocked in as California’s second-warmest calendar year. Averaged over the state as a whole, 2015 fell about one degree (Fahrenheit) shy of the record set in 2014, and came in
about one degree above the 3rd-warmest year, 1934.

Click to view slideshow.

“I was actually surprised that it was as warm as it was,” says Kelly Redmond, climatologist at the Western Regional Climate Center in Reno.

California might’ve seen a new record were it not for  a series of cold storms from the Gulf of Alaska that swept across Northern California in December. Kelly says temperatures for much of the year hovered around the normal range. The first three months of the year were all warmer than normal, setting expectations that 2015 might punch through the record-warm year of 2014.

Individual years aside, scientists say they expect the general warming trend to continue.

“The factors that are causing this long-term trend are continuing to accelerate,” says Schmidt, referring to the worldwide burning of fossil fuels that generates greenhouse gases, and the deforestation that reduces the land’s ability to absorb them.

“If you’re gonna be betting,” adds Thomas Karl, director of NOAA’s National Centers for Environmental Information, “I’d bet that 2016 will be warmer than 2015.”

Hope for Supporting Polar Science Brightens at the Bottom of the World

$
0
0

The seventh and concluding post in a series of dispatches from freelance writer Brandon Reynolds aboard the USCG icebreaker Polar Star, on its annual resupply mission to the research base, McMurdo Station. It’s a critical task imperiled by the nation’s aging, shrinking fleet of ice-breaking ships.

Everyone must inevitably deal, at some point, with “the break-up.” It wears different disguises in different places — the surprise invitation, the unexpected pregnancy, the phone call late in the night — but you know it simply as that which changes your direction.

In McMurdo Sound the break-up is what happens to the fast ice that stretches from volcanic Mt. Erebus on the east all the way west to the edge of the continent. Just about every year the ice around McMurdo breaks up late in the season. Wind force, melting caused by seawater and the actions of a certain plucky icebreaker destabilize the whole giant ice sheet where once we ran around with penguins.

The fast ice breaks away from land all the way to Mt. Erebus and begins floating north.
The fast ice breaks away from land all the way to Mt. Erebus and begins floating north. (Brandon R. Reynolds)

Thursday afternoon the captain mentioned that a crack had formed across the whole channel. By midnight a 147-square-mile section of the fast ice had broken off and begun floating away north. In a few hours, weeks of work spent grooming the channel all just blew away. Once, there was a path through ice. Now there’s open water. Imagine building a bridge every year, and every year it gets washed away.

We spent three days at McMurdo Station, which is a little like a mining town, or a moon colony. It feels very far from the rest of the world. The people are an interesting bunch, scientists and contractors, exactly the kind of people who wish to live very far from the rest of the world. There is pizza 24/7. Just down the road is New Zealand’s Scott Base, which is smaller and uniformly painted a delightful shade of pea green.

Lt. Junior Grade Jack Hall and Lt. Junior Grade Cyrus Unvala check the distance between the Ocean Giant and Polar Star.
Lts. Junior Grade Jack Hall and Cyrus Unvala check the distance between the Ocean Giant and Polar Star. (Brandon R. Reynolds)

We’re now in the midst of McMurdo’s annual resupply. The freighter Ocean Giant is docked, offloading a year’s worth of supplies and collecting a year’s worth of trash and freeze-dried poop, or so I hear. We’ll escort the Giant out, meet up with the fuel ship, bring it in. Once it’s offloaded its fuel, McMurdo will be supplied for the next year. Through McMurdo, the rest of the continent will be, too, because, as Capt. Matt Walker points out, “McMurdo is the major port in Antarctica, so all of Antarctica feeds off of McMurdo for its supplies and logistics.” It’s no exaggeration to say that the survival of the continent, meaning other U.S. bases but also many of the bases belonging to other nations, relies on McMurdo. It’s run by the National Science Foundation, which means, in a way, that NSF runs the continent. And NSF relies on Polar Star carving its thin lifeline in the ice, which nature, presently, will erase.

Soon we’ll get the hell out of here and the people at McMurdo will get the hell out of here, too, piling into ski-equipped C-130 turboprops and flying to Christchurch and points north. Then winter arrives to turn endless day into endless night, to blot out the sky with 200 mile-per-hour winds, and to replace the sheet of ice in McMurdo Sound as though none of us were ever here. Whatever memory this place has is carried deeper than the few meters of frozen water the ship plows through every year. We will be remembered by no one save a few photobombed penguins and the odd startled seal. Leave no trace, they say.

Executive Officer Cmdr. Mary Ellen Durley and Capt. Matt Walker look back at the turning basin as Walker breaks Polar Star into the pier at McMurdo Station.
Executive Officer Cmdr. Mary Ellen Durley and Capt. Matt Walker look back at the turning basin as Walker breaks Polar Star into the pier at McMurdo Station. (Brandon R. Reynolds)

Back in the world, with a nudge from President Obama, the Coast Guard this month put out the call for two new icebreakers, saying it plans to award a contract in late 2018 or ’19.

“I think the forces in play are going in the right direction,” says Walker, “and now that the public is aware of [the icebreaker mission] more so than it ever has been before, we might get some of the funding required.”

At the end of this mission, a good chunk of the Engineering department, which holds a lot of the institutional memory of the ship, will move on or retire. On next year’s Deep Freeze, many new folks will receive surprise invitations from Polar Star herself, possibly in the middle of the night, to come on down and repair something that’s gone totally sideways.

Capt. Matt Walker explains the route around Antarctica.
Capt. Matt Walker explains the route around Antarctica. (Brandon R. Reynolds)

Walker is leaving, too, not just Polar Star, but the organization. This is his last sail for the Coast Guard. He’s retiring in 2017 after a year in Saudi Arabia. That’ll be 30 years in the Coast Guard, 21 of which he has spent at sea, which is a tremendous amount of time to be underway.

“I’m not a gray flannel cubicle kind of guy,” he says. “I’m an adventurous kind of guy, I like to get out and see the world.”

Walker’s happy that his last mission underway was Polar Star.

“I think we’ve achieved a lot of significant milestones in the last few years after we brought the Polar Star back to life,” he says. “Even though she is old and she breaks down a lot. We’ve proven to the world that we’re the only vessel really that can dependably break out McMurdo.”

What I’ve figured out that means is that the icebreaker supports scientific experiments, but also the American experiment. The mission, says Walker, “is essential to mankind and distinguishes us from the animals in that search for science and knowledge. And why would we forfeit that?” On a strategic level, “it’s critical for us to be able to navigate all the waters of the world.”

Down here, science and politics and national priorities converge along with all the other lines.

View of McMurdo Station from Observation Hill, where a cross has been erected to the Robert Falcon Scott expedition, whose members died on their return from the South Pole. Polar Star is docked. Note the turning basin at left and the channel, dimly visible, which runs out to open water in the distance.
View of McMurdo Station from Observation Hill, where a cross commemorates the Robert Falcon Scott expedition, whose members died on their return from the South Pole. Polar Star is docked in the distance. Note the turning basin at left and the channel, dimly visible, which runs out to open water in the distance. (Brandon R. Reynolds)

Everything about this place tells the average shivering, possibly dying human that we’re the unnatural element. This has worked out remarkably well for the continent. “One of the most dramatic things about Antarctica is that there is no smog,” says Walker. “You see a mountain range that is 50 to 100 miles away, It’s crystal clear, not like anywhere where humans occupy. There’s pure air down here.”

That it’s unspoiled makes it desirable for scientists who want to get an unobstructed view of the history of the Earth by looking down and the universe by looking up. It also, of course, makes it desirable for many nations, who see opportunity in the possible wealth of resources beneath the surface.

So in the laboratory of Antarctica, what’s revealed about international cooperation may be as important as any other discovery. None of this will be readily apparent.

“For the young kids, when we sail, they’re down there sweeping the decks, cleaning dishes in the scullery — they don’t get to see the big picture,” Walker says. “It’s very similar to the deck hands on Magellan’s crew or Columbus’ crew: They were just steaming along doing their daily job.”

In just a few hours, the fast ice covering McMurdo Sound begins breaking up, taking the channel with it.
In just a few hours, the fast ice covering McMurdo Sound begins breaking up, taking the channel with it. (Brandon R. Reynolds)

“But breaking out McMurdo — we might save the world through some scientific discovery that they find in Antarctica,” ventures Walker. “We might not know it today or tomorrow, but maybe, in 10 years, 20 years from now, we might be able to say, ‘Hey, I participated in that, I contributed to that, by washing dishes on the Polar Star.’”

Maybe someday they will realize how they’re participating in this experiment for the future of Earth, or whatever’s beyond Earth. Maybe they’ll turn on the holographic TV we’ve all had genetically wired into our brains, and watch the first Earthlings plant a future flag on a distant planet, and they’ll connect themselves to that moment, from alien soils back through cold space, from space down through the aurora at the bottom of the world, and across a peaceful continent, and through the ice, to where they were once underway, making a way.

And that’s a whole other story, but that’s for later. For now, there’s a continent to save for one more year and, a world away, the world we want to hurry up and return to.

Brandon R. Reynolds lives in Los Angeles but currently summers in the Antarctic Circle. He has written for San Francisco Magazine, SF Weekly, The Atlantic, and Oxford American. On Twitter @sonnyborderland.


El Niño: It’s One For the Books — But Not Behaving As Expected

$
0
0

The prospect of an El Niño event in the Pacific Ocean always generates a stew of excitement, dread, and speculation in California. This largely stems from the fact that two of California’s wettest winters on record — 1982-1983 and 1997-1998 — occurred during the strongest El Niño years in living memory. The popular perception that El Niño always brings a lot of water to the Golden State, though, is not particularly accurate.

The key message here: strong El Niño events are the ones to watch out for from a California weather perspective, and it’s reasonable to expect that such events greatly increase the odds of wet conditions throughout the state.

Subtropical ridging between Hawaii and California has been more prominent so far during 2015-2016 than during the 82/83 or 97/98 events.
Subtropical “ridging” between Hawaii and California has been more prominent so far during 2015-2016 than during the 82/83 or 97/98 events. (NCEP via ESRL)

How is this El Niño different from other ‘Big Ones?’

Depending on how you measure it, the present El Niño is either the strongest or among the strongest events in the observed record going back to at least 1950. Ocean temperatures in the eastern equatorial Pacific Ocean — the most traditional measure of El Niño’s amplitude — have been at or above record-high values for at least several months now. So despite assertions to the contrary, the 2015-2016 El Niño is not “a bust” by any means.

But absolute sea surface temperatures don’t always tell the whole story. While the present El Niño is indeed among the strongest ever recorded, the atmospheric response to the warm ocean temperatures this year has been a bit different than we have observed during other big historical events. Over the northeastern Pacific, El Niño acts to deepen the semi-permanent Gulf of Alaska low-pressure zone while simultaneously strengthening (and, literally, straightening) the jet stream over the eastern Pacific Ocean. This enhanced and “more zonal” (i.e. more west-to-east) jet stream is what tends to bring increased winter precipitation to California (and, sometimes, as we’re seeing now, even the Pacific Northwest) during strong El Niño years.

Tropical convection associated with the 2015-2016 El Niño has been centered further north than in previous big events, with subsidence (downward motion) occurring closer to California on its northern flank.
Tropical convection associated with the 2015-2016 El Niño has been centered farther north than in previous big events, with subsidence (downward motion) occurring closer to California on its northern flank. (NCEP via ESRL)

Tropical convection associated with the 2015-2016 El Niño has been centered further north than in previous big events, with subsidence (downward motion; yellow/red colors) occurring closer to California on its northern flank

These atmospheric effects are the product of a fairly complex chain of events that link the tropical to the mid-latitude atmosphere. Warmer-than-usual ocean temperatures in the eastern tropical Pacific increase thunderstorm activity there, which pumps vast quantities of heat into the upper atmosphere. This tropically warm air at upper levels eventually flows northward and drops back toward the surface of the Earth in the subtropics (at a latitude roughly equivalent to that of Hawaii). This enhanced “Hadley circulation” during El Niño years increases the temperature differential between the warm tropics and cool Gulf of Alaska, which is what causes the jet stream to strengthen.

Skipping the Southland

In late 2015 and early 2016, the atmosphere has responded to the ongoing powerful El Niño much in the way that meteorologists have come to expect. The Pacific warmed; tropical thunderstorms increased; the Hadley cell strengthened; the Pacific jet began to roar. But this year, the Hadley cell has actually strengthened a bit more than expected. The descending air on its northern side has occurred closer to California, which means that enhanced temperature differential is occurring farther to the north than during previous big El Niño events. Subtropical ridging between Hawaii and California has been more pronounced, and the El Niño-strengthened jet stream has set up shop primarily across Northern California and even the Pacific Northwest, rather than Southern California. From a global climate perspective, this is a relatively minor detail; if you happen to live in Los Angeles, though, it makes all the difference in the world.

The net effect so far in 2015-2016: Northern California and the Pacific Northwest have gotten soaked, while Southern California has been left pretty dry (with a few notable exceptions). While a veritable “parade of storms” has indeed inundated the northern reaches of the state with very heavy precipitation, bringing the best Sierra Nevada snowpack in years, leading to huge inflows to large reservoirs in critical watersheds, and even leading to some minor flooding at times, many of California’s most populous cities haven’t witnessed an especially remarkable winter to date. The San Francisco Bay Area and Sacramento region have seen “Water Year” precipitation to date that is pretty close to the long-term average (which seems like a lot relative to the extremely dry years witnessed as of late). The densely populated greater Los Angeles region, on the other hand, is well below average for the season to date (though with significant precipitation this past weekend, its January total may well end up near or above average). From a long-term drought relief perspective, the season to date looks pretty good—precipitation is near or above average in most of California’s largest watersheds, and the water stored in the critical Sierra Nevada snowpack is uniformly above average. So far, though, this isn’t quite the blockbuster year that many had hoped for (especially in the south).

While nearly all of California is expected to be above average in terms of season-to-date precipitation after this weekend’s Southern California storm, only the northern 2/3 of the state is above average for the full season to date.
While nearly all of California is expected to be above average in terms of season-to-date precipitation after this weekend’s Southern California storm, only the northern 2/3 of the state is above average for the full season to date.? (NOAA via WRCC)

So, What Now?

El Niño is certainly still with us, and it’s still a top-tier event. For that reason, the smart money’s still on a wetter-than-average season for California on balance. This is especially true since the precipitation during strong El Niño years is often heavily “back-weighted,” with an unusually large fraction of seasonal totals occurring during the second half of the rainy season from February to April. What is less clear, at this point, is whether the northerly-shifted atmospheric response to this El Niño will persist — and whether Southern California will start to make up for lost time. It’s certainly possible, and it’s easy to forget that a surprisingly large fraction of precipitation in the Southland occurs during a handful of intense storms each year (even in strong El Niño years). From a statewide perspective, some substantial drought relief has already occurred this year, but there remain large regions in the southern part of the state that are still extremely dry. The refrain from earlier in the autumn is now more relevant than ever: while El Niño is likely to bring some degree of drought relief, California will likely still be facing long-term drought conditions by the coming summer.

The Big Picture

Finally, there has been considerable discussion lately regarding why the atmospheric response to El Niño this year has been different than historically observed (and also than foreseen by some of the flagship seasonal forecast models). It’s impossible to ignore the fact that global temperatures in late 2015 and early 2016 have reached their highest levels in recorded human history. Part of this very recent warming is likely a product of our record El Niño event, but the rest is pretty clearly attributable to the long-term warming trend associated the with human emission of greenhouse gases. While global mean temperature doesn’t directly affect El Niño teleconnections, per se, the Earth hasn’t been warming in a spatially uniform way. This year in particular, the subtropics and the polar regions have been especially warm relative to other parts of the world. It is possible that this spatial pattern of warming may be playing a role in the particular atmospheric configuration that has resulted from the 2015-2016 El Niño event.

Unfortunately, it is virtually impossible to say more than that right now. The pace of climate change attribution science is much slower than that of the atmosphere itself, and it’s hard to make causal inferences from observations alone. Climate models are often the best tool available for climate scientists to test the counterfactual: what would this year have looked like without global warming? Such experiments take a considerable amount of time, so we’ll probably have to wait a while to find out. Stay tuned.

Daniel Swain is an atmospheric scientist at Stanford’s School of Earth, Energy & Environmental Sciences. A version of this post also appears on his California Weather blog.

Earthquake Warnings on Your Phone: There’s (Almost) an App for That

$
0
0

Having an earthquake warning system on everybody’s cell phone is sort of the holy grail of seismic civil defense. It appears that we’re halfway there.

On Friday, scientists at U.C. Berkeley unveiled MyShake, an app that makes smartphones an extension of the seismic detection and reporting network that’s already in place.

“The idea of MyShake is to use phones to record the earthquake as well as push out information about it,” says Richard Allen, who directs the U.C. Berkeley Seismological Lab.

At first glance, the idea would appear to leapfrog current efforts to test a workable warning system for earthquakes in California, but the app doesn’t yet turn that information around to provide personal warnings prior to the shaking.

“This is a citizen science research project at this point,” cautions Allen. “We still have to put this out on many phones, we have to test the algorithms we have, and see how good it is at actually detecting the earthquakes and then estimating the locations.”

The app takes advantage of accelerometers already built into every phone, the gadgets that sense movement and direction. The algorithm, developed by grad student Qingkai Kong, is designed to distinguish between earth movement and, say, dancing to techno music with the phone in your back pocket, and can pick up initial vibrations from a magnitude 5 or greater quake.

Meanwhile, the phones will add a potentially dense layer of sensors to the existing statewide network, which Allen describes as “high-quality” but relatively sparse. The current network has about 400 highly sensitive sensing stations, most clustered near heavily populated areas. By contrast there are something like 16 million cell phones roaming around California in people’s pockets and purses.

“Cell phones are never going to replace that traditional network,” says Allen,  “but we think that cell phones can contribute to it here in California.” Eventually, he says a phone-based warning system could save lives in countries with no other warning networks in place.

“Generally when we push out warnings, we want them to go over every media that we can come up with,” says Allen. “Phones are clearly are a very a important one; people have phones with them all the time, night and day.”

Given how long it often takes to make a simple phone connection on a crowded cellular network, it’s hard to imagine that phones could be a useful warning device when fractions of seconds count. But Allen says the lab’s testing has shown that warnings could be turned around and dispatched in “a few tenths of a second.”

California's current warning system, ShakeAlert, is still in the testing phase and has been hobbled by funding gaps.
California’s current warning system, ShakeAlert, is still in the testing phase and has been hobbled by funding gaps. (Berkeley Seismological Laboratory)

For users relatively close to a temblor’s epicenter, seconds is typically all the warning they get with current technology. When a magnitude 6 quake shook the Napa Valley in August 2014, people testing the PC-based ShakeAlert system in Berkeley got about eight seconds’ warning to duck and cover.

“In the future we hope that MyShake — the phone recordings — could contribute to ShakeAlert, but we have research to do before we get to that point,” says Allen. For researchers to know the true potential of the phone-based system, Allen says thousands of people will need to download the app.

“The more people who download, the more quickly we’ll get to the point where we could use it,” he urges.

One impediment to that: MyShake is launching with only the Android version for now. Allen says the intent is to follow with an app for Apple iPhones but he can’t say how soon that will happen — that an iOS version requires a whole separate development project.

El Niño Weakening, Stage Set for La Niña and Possible Dry Winter Next Year

$
0
0

Federal climate scientists say the near-record El Niño conditions in the Pacific Ocean have peaked and are slowly waning.

Forecasters now say conditions are likely to flip to their opposite phase, known as La Niña by late summer or early fall, which could set the stage for another drier-than-normal winter and prolonged drought in California.

“We are reasonably confident that there will be a La Niña,” says Huug van den Dool, seasonal forecaster at NOAA’s Climate Prediction Center, “but we plead ignorance as to whether this is going to be a small, moderate, or strong La Niña.”

Just as the stronger El Niños tend to favor wetter winters in California, the mirror-image La Niña is sometimes a harbinger of drought. Strength is measured by how much ocean waters deviate from their normal temperatures. Warmer waters provide more moisture to brewing Pacific storms, while colder waters tend to dry things out.

The shift is not likely to have major implications for what remains of this winter. California’s weather tends to lag the ocean conditions that influence it by as much as a couple of  months, so the possibility still lingers for a soggy spring.

NOAA's three-month outlook (which is notoriously iffy) pegs the odds for above-average precipitation at 73% for Southern California and 66% for the state's midsection (map numbers converted to actual percentages).
NOAA’s three-month outlook (which is notoriously iffy) pegs the odds for above-average precipitation at 73% for Southern California and 66% for the state’s midsection (map numbers converted to actual percentages). (NOAA)

The abnormally warm water along the equator that defines El Niño probably peaked in December, van den Dool told reporters in a Thursday conference call, but still has some steam left in the boiler, seen in the rapid upward movement of warm, moist air over the ocean.

Van den Dool points to sea surface temperatures that remain above normal, promoting “very strong convection” over the eastern and central Pacific. Convection is a key driver of storm activity.

Van den Dool says it’s too early to say with certainty whether the current El Niño (now about six months old) is the strongest on record.

“This is something that’s going to be debated, of course, for some time,” he predicts.

Using only the sea surface temperatures in one closely-watched zone of the Pacific, he says this one is “at least on par with 1997-98.”

Curiously, though this event has not packed nearly the precipitation punch as the “Godzilla” El Niño of 97-’98, when San Francisco doubled it’s normal rainfall. The complex reasons for that will be part of the ongoing scientific debate, but so far this winter, many California locations are still at or below their long-term averages for rainfall. San Francisco, Sacramento and San Jose remain below normal, as does Santa Rosa, a perennial Bay Area wet spot. Fresno, by contrast, has seen 40 percent more than its usual rainfall at this point in the season.

The Sierra snowpack, which typically provides about a third of the state’s water supply, was piling up pleasingly in January, but has now slipped slightly below seasonal norms.


MAP: California Water Conservation Misses Governor’s Mandate in January

$
0
0

For the first time since mandatory statewide restrictions were imposed, Californians missed Governor Jerry Brown’s water conservation target in January.

On average, local water suppliers delivered 17.1 percent less water than in January of 2013. That pulls the cumulative savings rate below the governor’s mandatory threshold of 25 percent. It’s the sixth straight month that water savings has fallen off among Californians.


Hover over the dots to see if your district met its water saving goal.

Despite that trend, the state’s top water regulator is happy with the overall drought response from consumers.

“Californians have risen to the occasion as never before,” said State Water Resources Control Board chair Felicia Marcus in a conference call with reporters.

The state is holding local urban water suppliers responsible for cutting monthly water use by 25 percent compared to the same month in 2013. The statewide conservation rate peaked in July, when consumers cut their use by 31 percent compared to the base year.

WaterSvgs_1601

State water regulators had expected a drop in conservation during the winter months, when most homeowners have already reduced outside watering and have to find additional savings indoors.

Outside watering was likely further reduced by wet weather in January, particularly in Northern California. The parade of mild storms prompted TV meteorologist Paul Deanno to start keeping count. He tallied 11 separate rain systems that blew through the Bay Area in the first 22 days of January, essentially a storm every other day for three weeks running.

Then nature seems to have shut off the tap and most of February has been dry throughout the state. Regulators concede that conservation numbers are not likely to improve when the February numbers come in.

“February’s been a bear, with no disrespect to bears,” Marcus told reporters, referring to the recent dearth of rain and record high temperatures. “When its hot and dry, people want to turn on their sprinklers.”

If there was a silver lining in January, it was that on a per-capita basis, urban consumers used an average of 61 gallons per day, the lowest figure reported in the eight months that officials have been keeping records. The daily per-capita figure for Bay Area residents was 49.5 gallons, bettered only slightly by Central Coast consumers. By comparison, when Australia suffered its recent decade-long drought, urban residents managed to squeeze per-capita water use down to near 35 gallons per day.

Despite the steadily dropping conservation rate, Max Gomberg, senior scientist with the water board, says officials have achieved 96 percent of the overall savings goal set for the drought emergency period ending this month.

“We’re very close,” Gomberg told reporters. “We are where we wanted to be.”

The governor’s original drought restrictions were intended to run through the end of this month, but Brown has already extended the rules into the fall of 2016, with some modifications. Regulators will review those rules in April and could make further adjustments based on the water supply outlook at that time.

Sierra Snowpack Shrinking — But More Is on the Way

$
0
0

There’s still plenty up there for skiers but Tuesday’s manual survey of the Sierra Snowpack didn’t do much to raise hopes for an imminent end to the drought.

And time is running out.

Statewide, the Sierra snowpack stands at just 83 percent of normal levels for this date — the southern Sierra is even skimpier at 75 percent, based on estimates of the snow’s water content.

After a series of cold storms off the northern Pacific gave an encouraging start to the snow season, accumulations briefly surged ahead of long-term averages — but February’s meager rain and temperatures in record-high territory quickly started shrinking the snowpack (Locations from Sacramento to San Diego recorded their hottest February on record). That’s a major source of anxiety for the state’s water managers, who traditionally count on the so-called “frozen reservoir” for about a third of California’s water supply.

“Right now, we’re obviously better than last year,” said Frank Gehrke, who heads the state’s snow surveys, “but still way below what would be considered adequate for any reasonable level of recovery at this point.”

That’s because the rain and snow season is also shrinking rapidly. California’s precipitation tends to drop off abruptly in April, and while the rains are forecast to return later this week, rising spring temperatures will make it hard to catch up on snow.

Climate Graph for Tahoe City shows how starkly precipitation declines and temperatures start to rise during the month of April.
Climate Graph for Tahoe City shows how starkly precipitation declines and temperatures start to rise during the month of April. (U.S. Climate Data)

A closely-watched indicator is the current snowpack compared to the average on April 1, when it’s generally at its peak for the season. Statewide, it’s currently just 73 percent of the April 1 average. That means the mountains need to add a quarter of one entire season’s average snow in the next four weeks, just to make it to average before the spring melt begins in earnest.

“We’re hoping for a miracle March and an awesome April,” the state’s top water regulator, Felicia Marcus told reporters last week. We might be getting a down payment over the next 10 days.

Forecasters at the National Weather Service describe the first Northern California system to arrive in March as “moisture-starved” with snowfall unlikely below 7,000 feet. But Stanford climate scientist Daniel Swain says the stronger series of storms lined up behind it could “add tremendously to the snowpack.”

Viewing all 77 articles
Browse latest View live


Latest Images